Overview

Optimize your histology lab with advanced analytics

Easily identify staffing, process and quality improvement opportunities with navify Analytics for Pathology Lab, which may reduce waste, increase efficiency and drive financial and operational value back to the histology lab.

Drive operational value

Get actionable insights to help improve operational efficiency.

Achieve greater impact

Quickly identify quality issues, track lab processes with alerts and reports and analyze trends to boost output.

Reduce turnaround times

Identify quality concerns that subsequently could help reduce turnaround time (TAT) without adding headcount.

Female laboratory technician in protective glasses and gloves working at a computer in a pathology lab, surrounded by test tubes and lab equipment.

navify® Analytics for Pathology Lab

Identify opportunities for staffing, process and quality improvements.

Features

Get the analytical data you need for astute decision making

Gain insight into real-time turnaround time KPIs and trends by tissue type and requestor. navify Analytics dashboard interface enables teams to easily analyze and follow the evolution of quality and performance indicators. Visualize workload and staffing data to optimize staffing levels and identify process bottlenecks for targeted improvements.

User interface of TAT KPIs and trends, displaying lab’s productivity and workload.

Visualize data to understand turnaround times and trends

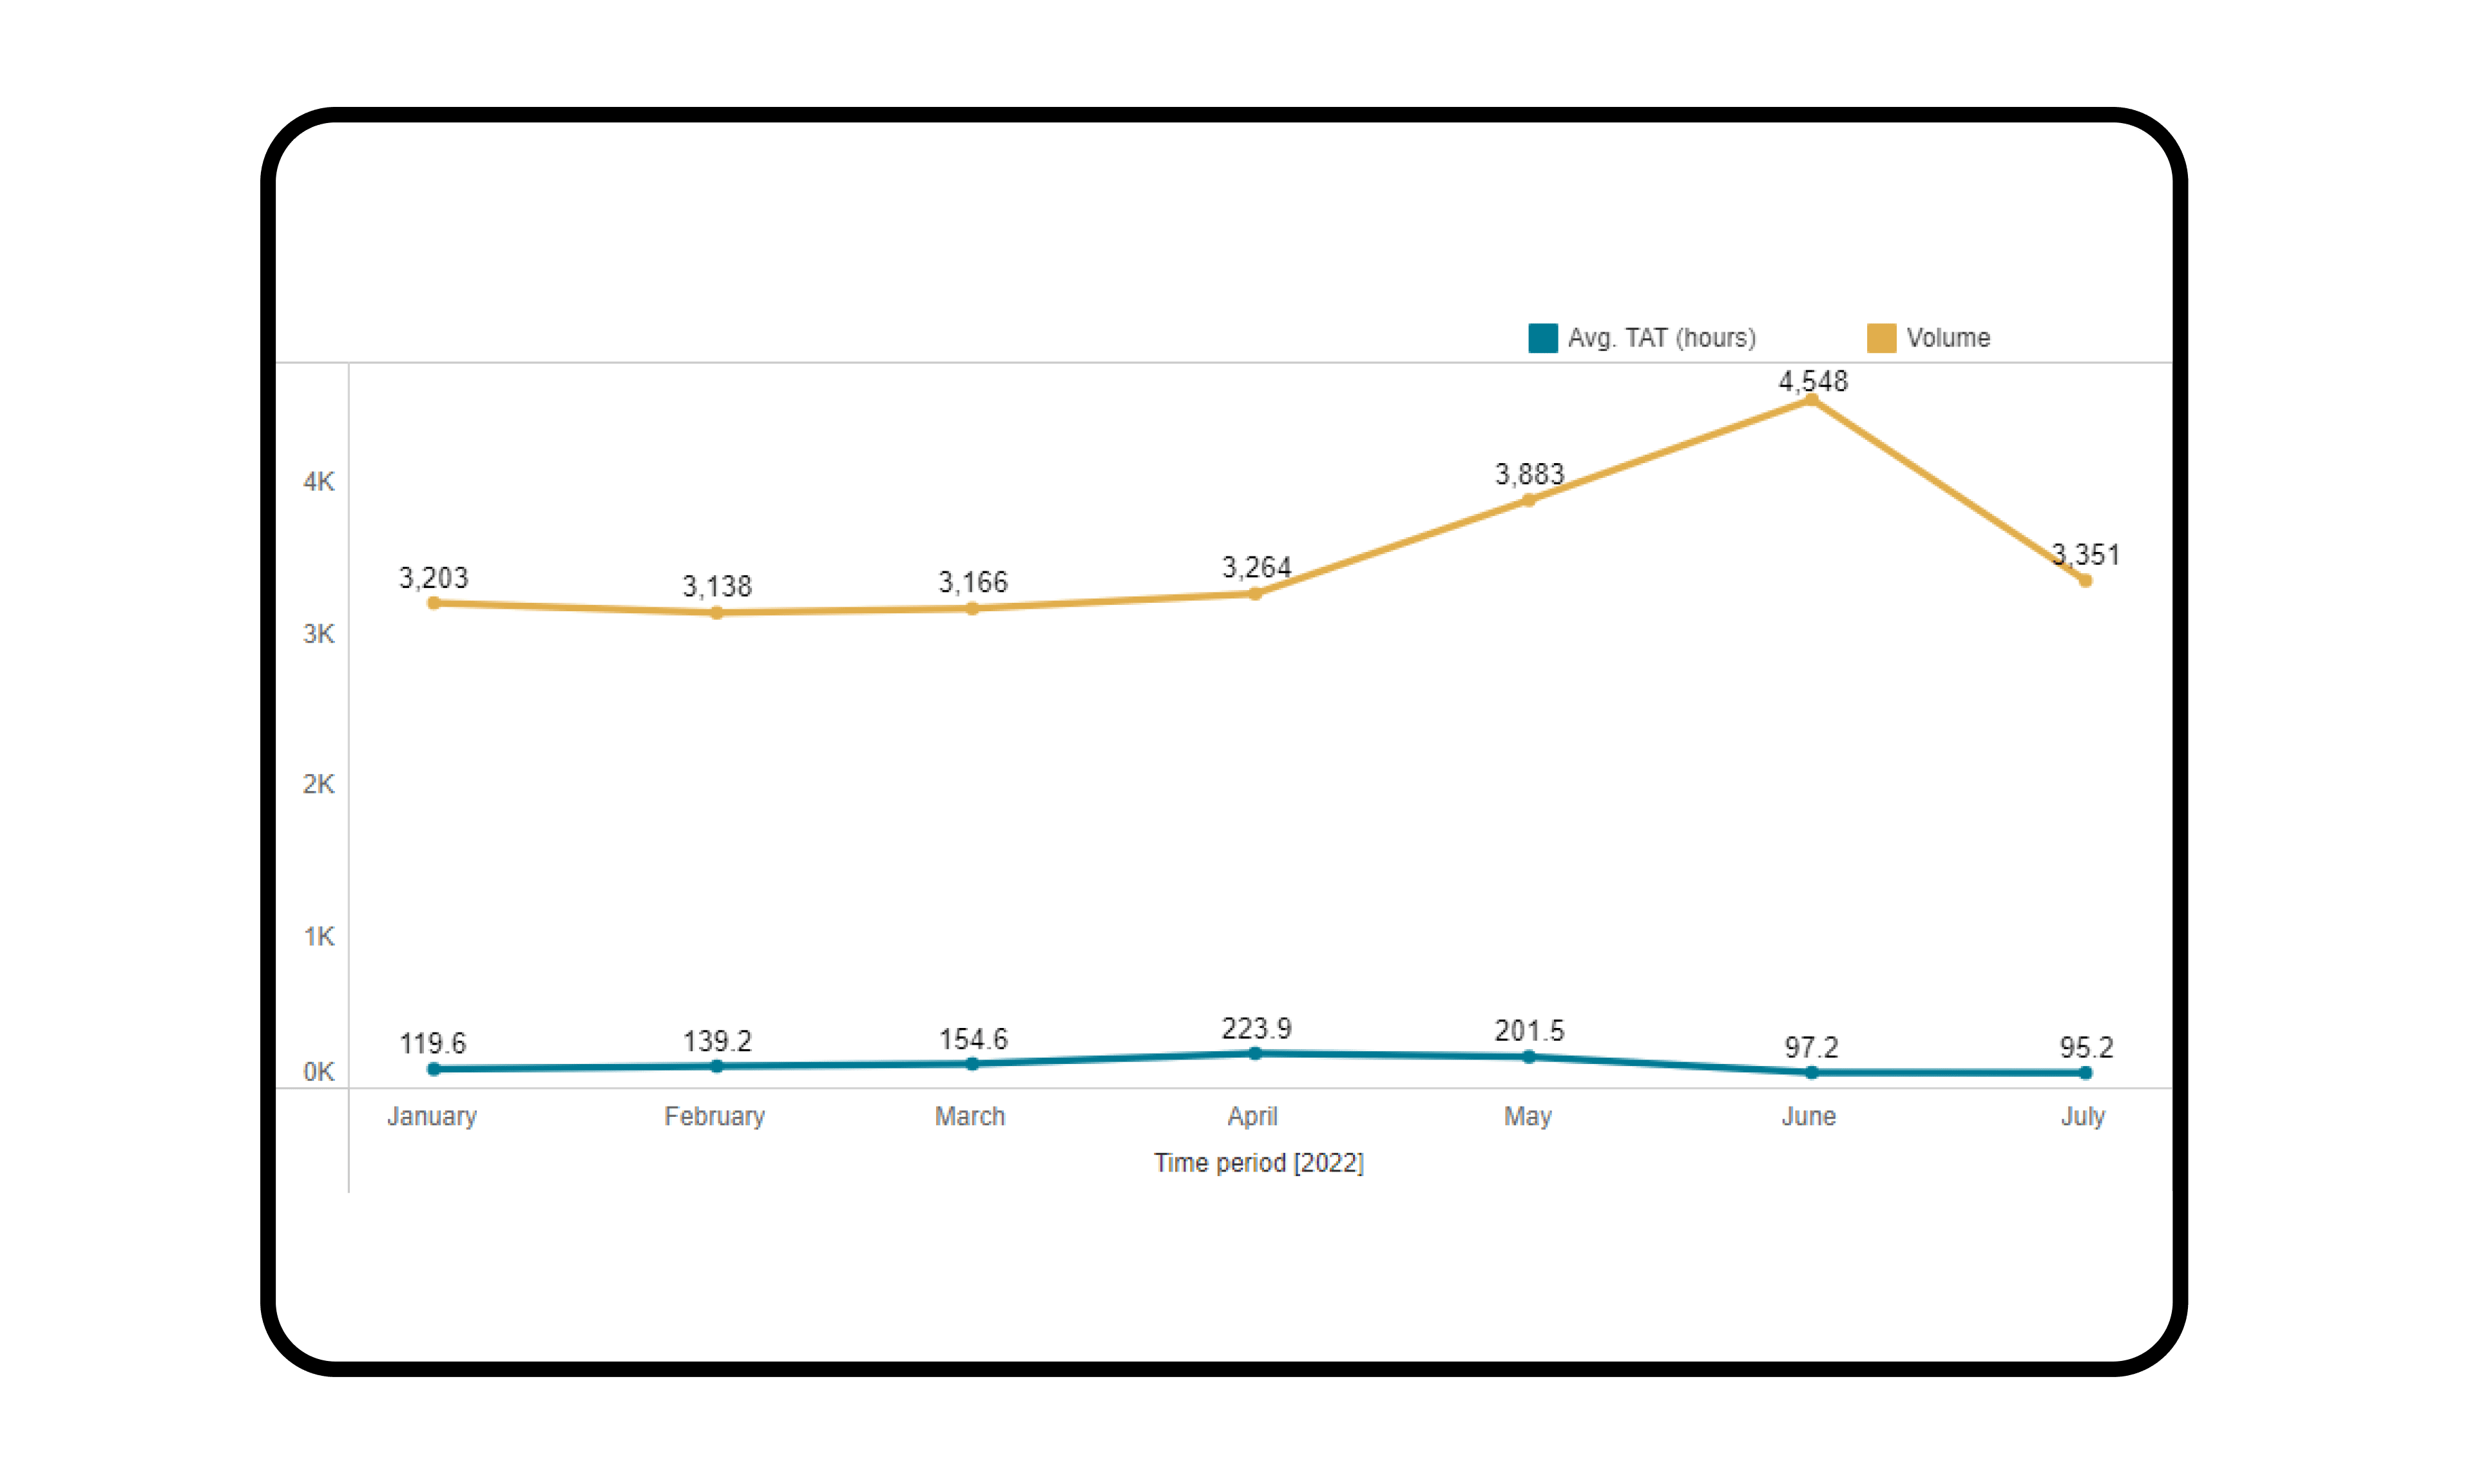
Get easy-to-read object volumes and TAT KPIs and trends, broken down by tissue types and requestors. Real-time data, coupled with automated reports, will give you high visibility into your lab’s productivity and workload.

Close-up of a scientist's hands typing on a laptop keyboard in a laboratory, with test tubes and a microscope in the background.

Access the information you need to optimize staffing levels

Visualize data that shows how changes in workload and staffing affect turnaround times. Use trends to adjust staffing parameters and to monitor the effectiveness of adjustments. Ultimately, increase output without adding headcount.

Two female scientists in a laboratory discussing data on a laptop, with a microscope and lab equipment visible in the background.

Identify process bottlenecks

Quickly identify workflow bottlenecks and direct your process improvement initiatives where they matter the most. 

Benefits

Gain actionable insights and optimize laboratory efficiency

 navify Analytics transforms lab data into insights for smarter decisions, enhancing workflow transparency with clear KPIs and trends. Optimize staffing, improve turnaround times and boost productivity by analyzing workload patterns without additional hires.

The backlog analysis highlights the department capacity limits. It is now possible to justify to management the need for resources to support increased activity, such as acquiring an additional cutting station and recruiting a full-time technician.

Christophe Bovin

Medical & Technical Director

Department of Pathology and Cytology

L’Institut Mutualiste Montsouris


Smiling female scientist wearing glasses and a lab coat in a bright, modern laboratory setting with blurred colleagues in the background.
FAQs

Frequently asked questions about navify Analytics for Pathology Lab

If you don’t find answers to your questions here, we’re happy to provide more information and discuss your needs in detail.

What is navify Analytics for Pathology Lab?

navify Analytics for Pathology Lab is a digital solution designed to enhance operational efficiency in histology labs. It provides actionable insights into staffing, processes and quality improvements, allowing labs to drive value through optimized workflows, reduced turnaround times (TAT) and better resource management.

How does navify Analytics for Pathology Lab help with decision making?

navify Analytics for Pathology Lab delivers insight into real-time turnaround time KPIs and trends by tissue type and requestor, with automated reports. It helps you visualize workload and staffing data to optimize staffing levels and identify process bottlenecks for targeted improvements, aiming at ultimately improving TAT without increasing headcount.

How does navify Analytics for Pathology Lab help optimize laboratory efficiency?

navify Analytics for Pathology Lab transforms lab data into insights for smarter decisions, enhancing workflow transparency with clear KPIs and trends.

How can I use navify Analytics for Pathology Lab to help the team undertake process changes?

navify Analytics for Pathology Lab supports process improvements by providing real-time data and alerts that highlight workflow bottlenecks. With automated reports and notifications, your team stays informed about key performance indicators (KPIs) and lab processes, enabling targeted, data-driven improvements where they matter most.

Explore more

Discover more from our portfolio

At Roche Diagnostics, we understand the need to go beyond our products and see the bigger picture, creating a world where product and services come together. Roche Service Solutions refers to our service offering and encompasses our full service portfolio. Our total solution package means we can provide you with the personalised mix of products and services you need. Our digital services enable you to quickly connect with us and help make your life more manageable.

Visit website
Disclaimer
  • Not every digital product is available in all markets. The use of any third-party app is subject to a separate license agreement with the respective third-party app developer. Roche gives no warranties (express or implied) with regard to any third-party app. Third-party apps might not be available in your country. This website and its content may be accessible worldwide, Roche assumes no liability with regard to the access to the information, which may not be compatible with legislations or regulations in force in your country.
  • MC--15666